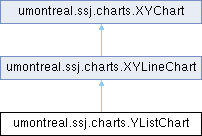
Extends XYLineChart; each YListChart object is associated with a YListSeriesCollection data set. More...
Public Member Functions | |
| YListChart () | |
| Empty constructor. | |
| YListChart (String title, String XLabel, String YLabel, double[]... data) | |
| Initializes a new YListChart instance with set of points data. | |
| YListChart (String title, String XLabel, String YLabel, boolean flag, double[]... data) | |
Similar to the constructor YListChart(title, XLabel, YLabel, data) above. | |
| YListChart (String title, String XLabel, String YLabel, double[] data, int numPoints) | |
| Initializes a new YListChart instance with a set of points data. | |
| YListChart (String title, String XLabel, String YLabel, double h, double[] data, int numPoints) | |
Similar to the constructor YListChart(title,
XLabel, YLabel, data, numPoints) above, but the points are \((h(j+1),
\mbox{\texttt{data}}[j])\). | |
| YListChart (String title, String XLabel, String YLabel, double[][] data, int numPoints) | |
| Initializes a new YListChart instance with set of points data. | |
| Public Member Functions inherited from umontreal.ssj.charts.XYLineChart | |
| XYLineChart () | |
| Initializes a new XYLineChart instance with an empty data set. | |
| XYLineChart (String title, String XLabel, String YLabel, double[][]... data) | |
| Initializes a new XYLineChart instance with sets of points data. | |
| XYLineChart (String title, String XLabel, String YLabel, double[][] data, int numPoints) | |
| Initializes a new XYLineChart instance with sets of points data. | |
| XYLineChart (String title, String XLabel, String YLabel, double[][] data, int x, int y) | |
| Initializes a new XYLineChart instance using subsets of data. | |
| XYLineChart (String title, String XLabel, String YLabel, DoubleArrayList... data) | |
| Initializes a new XYLineChart instance with data data. | |
| XYLineChart (String title, String XLabel, String YLabel, XYSeriesCollection data) | |
| Initializes a new XYLineChart instance with data data. | |
| int | add (double[] x, double[] y, String name, String plotStyle) |
| Adds a data series into the series collection. | |
| int | add (double[] x, double[] y) |
| Adds a data series into the series collection. | |
| int | add (double[] x, double[] y, int numPoints) |
| Adds a data series into the series collection. | |
| int | add (double[][] data) |
| Adds the new collection of data series data into the series collection. | |
| int | add (double[][] data, int numPoints) |
| Adds the new collection of data series data into the series collection. | |
| XYListSeriesCollection | getSeriesCollection () |
| Returns the chart’s dataset. | |
| void | setSeriesCollection (XYListSeriesCollection dataset) |
| Links a new dataset to the current chart. | |
| void | setTicksSynchro (int s) |
| Synchronizes \(X\)-axis ticks to the \(s\)-th series. | |
| JFrame | view (int width, int height) |
| Displays chart on the screen using Swing. | |
| JFrame | viewBar (int width, int height) |
| Displays bar chart on the screen using Swing. | |
| String | toLatex (double width, double height) |
| Exports the chart to a LaTeX source code using PGF/TikZ. | |
| Public Member Functions inherited from umontreal.ssj.charts.XYChart | |
| JFreeChart | getJFreeChart () |
| Returns the JFreeChart object associated with this chart. | |
| Axis | getXAxis () |
| Returns the chart’s domain axis ( \(x\)-axis) object. | |
| Axis | getYAxis () |
| Returns the chart’s range axis ( \(y\)-axis) object. | |
| String | getTitle () |
| Gets the current chart title. | |
| void | setTitle (String title) |
| Sets a title to this chart. | |
| void | setprobFlag (boolean flag) |
| Must be set true when plotting probabilities, false otherwise. | |
| void | setAutoRange () |
| The \(x\) and the \(y\) ranges of the chart are set automatically. | |
| void | setAutoRange (boolean right, boolean top) |
| The \(x\) and the \(y\) ranges of the chart are set automatically. | |
| void | setAutoRange00 (boolean xZero, boolean yZero) |
| The \(x\) and the \(y\) ranges of the chart are set automatically. | |
| void | setManualRange (double[] range) |
| Sets the \(x\) and \(y\) ranges of the chart using the format: range =
[xmin, xmax, ymin, ymax]. | |
| void | setManualRange (double[] range, boolean right, boolean top) |
| Sets the \(x\) and \(y\) ranges of the chart using the format: range =
[xmin, xmax, ymin, ymax]. | |
| void | setManualRange00 (double[] range, boolean xZero, boolean yZero) |
| Sets the \(x\) and \(y\) ranges of the chart using the format: range =
[xmin, xmax, ymin, ymax]. | |
| double | getChartMargin () |
| Returns the chart margin, which is the fraction by which the chart is enlarged on its borders. | |
| void | setChartMargin (double margin) |
| Sets the chart margin to margin. | |
| void | drawVerticalLine (double x, String name, double yfrac, boolean right) |
| Draws a vertical line on the chart at \(x\)-coordinate x. | |
| void | enableGrid (double xstep, double ystep) |
| Puts a grid on the background. | |
| void | disableGrid () |
| Disables the background grid. | |
| void | toLatexFile (String fileName, double width, double height) |
| Transforms the chart to LaTeX form and writes it in file fileName. | |
| void | setLatexDocFlag (boolean flag) |
Flag to remove the \documentclass (and other) commands in the created LaTeX files. | |
Additional Inherited Members |
Detailed Description
Extends XYLineChart; each YListChart object is associated with a YListSeriesCollection data set.
The data is given as one or more lists of \(y\)-coordinates. The \(x\)-coordinates are regularly-spaced multiples of the indices of the data points.
Definition at line 35 of file YListChart.java.
Constructor & Destructor Documentation
◆ YListChart() [1/6]
| umontreal.ssj.charts.YListChart.YListChart | ( | ) |
Empty constructor.
Definition at line 40 of file YListChart.java.
◆ YListChart() [2/6]
| umontreal.ssj.charts.YListChart.YListChart | ( | String | title, |
| String | XLabel, | ||
| String | YLabel, | ||
| double...[] | data ) |
Initializes a new YListChart instance with set of points data.
title is a title, XLabel is a short description of the
\(x\)-axis, and YLabel a short description of the \(y\)-axis. The input vectors represents a set of plotting data. More specifically, each vector data represents a \(y\)-coordinates set. Position in the vector will form the \(x\)-coordinates. Indeed, the value data \([j]\) corresponds to the point \((j+1, \mathtt{data}[j])\) (but rescaled) on the chart.
- Parameters
-
title chart title. XLabel Label on \(x\)-axis. YLabel Label on \(y\)-axis. data series of point sets.
Definition at line 62 of file YListChart.java.
◆ YListChart() [3/6]
| umontreal.ssj.charts.YListChart.YListChart | ( | String | title, |
| String | XLabel, | ||
| String | YLabel, | ||
| boolean | flag, | ||
| double...[] | data ) |
Similar to the constructor YListChart(title, XLabel, YLabel, data) above.
Except that if flag is true, the points are \((j+1, \mbox{\texttt{data}}[j])\) for each series; but if flag is false, the points are \(((j+1)/n, \mbox{\texttt{data}}[j])\), where \(n\) is the number of points of each series in data.
- Parameters
-
title chart title. XLabel Label on \(x\)-axis. YLabel Label on \(y\)-axis. flag to choose the step between \(x\)-coordinates data series of point sets.
Definition at line 82 of file YListChart.java.
◆ YListChart() [4/6]
| umontreal.ssj.charts.YListChart.YListChart | ( | String | title, |
| String | XLabel, | ||
| String | YLabel, | ||
| double[] | data, | ||
| int | numPoints ) |
Initializes a new YListChart instance with a set of points data.
title is a title, XLabel is a short description of the
\(x\)-axis, and YLabel a short description of the \(y\)-axis. The input vector represents a set of plotting data. Position in the vector gives the \(x\)-coordinates of the curve. The value data \([j]\) corresponds to the point \((j+1\), data \([j]\)) (but rescaled on the chart) for the curve. However, only the first numPoints of data will be considered to plot the curve.
- Parameters
-
title chart title. XLabel Label on \(x\)-axis. YLabel Label on \(y\)-axis. data point set. numPoints number of points to plot
Definition at line 105 of file YListChart.java.
◆ YListChart() [5/6]
| umontreal.ssj.charts.YListChart.YListChart | ( | String | title, |
| String | XLabel, | ||
| String | YLabel, | ||
| double | h, | ||
| double[] | data, | ||
| int | numPoints ) |
Similar to the constructor YListChart(title,
XLabel, YLabel, data, numPoints) above, but the points are \((h(j+1),
\mbox{\texttt{data}}[j])\).
- Parameters
-
title chart title. XLabel Label on \(x\)-axis. YLabel Label on \(y\)-axis. h step between \(x\)-coordinates data point set. numPoints number of points to plot
Definition at line 124 of file YListChart.java.
◆ YListChart() [6/6]
| umontreal.ssj.charts.YListChart.YListChart | ( | String | title, |
| String | XLabel, | ||
| String | YLabel, | ||
| double | data[][], | ||
| int | numPoints ) |
Initializes a new YListChart instance with set of points data.
title is a title, XLabel is a short description of the
\(x\)-axis, and YLabel a short description of the \(y\)-axis. The input vectors represents a set of plotting data. More specifically, for a \(n\)-row matrix data, each row data \([i], i=0,…, n-1\), represents a \(y\)-coordinate set for a curve. Position in the vector gives the \(x\)-coordinates of the curves. Indeed, the value data \([i][j]\) corresponds to the point \((j+1\), data \([i][j]\)) (but rescaled on the chart) for curve \(i\). However, only the first numPoints of each data \([i]\) will be considered to plot each curve.
- Parameters
-
title chart title. XLabel Label on \(x\)-axis. YLabel Label on \(y\)-axis. data series of point sets. numPoints number of points to plot
Definition at line 151 of file YListChart.java.
The documentation for this class was generated from the following file:
- src/main/java/umontreal/ssj/charts/YListChart.java